Over the last year, we were negative on gold because of on-going FED rate hikes. In the previous quarter, we turned neutral on gold on the expectation that the pace of the FED rate hikes across 2019 will slow. Across 1Q this year, gold has climbed steadily from USD 1,280 / oz to the current level of USD 1,320 / oz. Last week, the FED has signaled clearly that its hiking cycle has come to an end. As such, we have raised our gold call to positive in our latest Quarterly Global Outlook 2Q19, published last Friday 22 Mar.
Gold Draws Strength From Dovish Turn In The FED
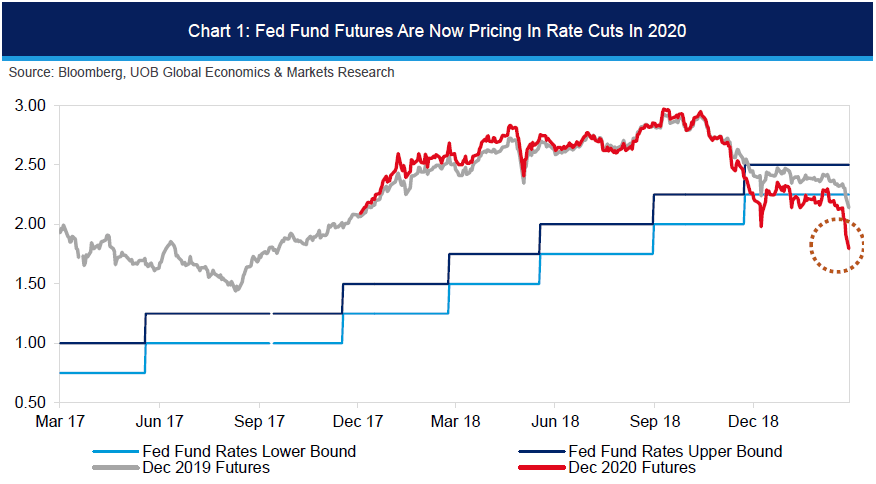
A key driver of our renewed confidence in gold is the end of the current rate hiking cycle for the FED. We no longer see any more rate hikes from the FED going forward. In addition, we also see a further risk of a rate cut from the FED in 2020. Interest rate futures are indeed pricing in increasing risks of a rate cut from the FED in 2020. Furthermore, the FED has also started to dial down Balance Sheet Reduction (BSR) and added that BSR will stop by September. This is very positive for gold.
Net Long Positioning Has Returned For Gold
In addition, since the start of the year, the USD has turned defensive. In particular, the USD retreated against most EM and Asian currencies. Against the Majors, the USD has managed to somewhat stay afloat. Renewed growth concerns across Europe had prevented the EUR from taking advantage of this dovish turn in the FED. Hence, it is no surprise that after a sustained drawdown across 2018, net positioning in gold has recovered to a healthy net long by the end of 1Q19. Previously, after a series of four rate hikes across 2018, gold positioning had dipped briefly to a net short in 4Q last year. This return of net long positioning can be taken as a sign of reallocation into gold.
China May Have Renewed Allocation Of Reserves Into Gold
Of interesting note is the renewed climb in China’s gold reserves. After holding steady at 59.24 mio oz across 2017 and 2018, China’s gold reserves started to climb across 1Q19, pass the 60.00 mio oz level to 60.26 mio oz by end Feb 2019. Strictly speaking, at just above 60 mio oz, China’s gold reserves is worth “only” USD 78 bn or barely 2.5% of China’s total reserves of USD 3.1 trn. This renewed climb in China’s gold reserves comes at a sensitive time during the US-China trade conflict. Officials from China’s State Administration of Foreign Reserves (SAFE) have made no particular mention of this, but China may have just embarked on a renewed allocation of reserves into gold.
We See Gold Rising To USD 1,400 / oz By End 2019
Overall, in view of the above positive drivers, 1) end to FED’s hiking cycle, 2) return of net long positioning and 3) possible renewed reallocation of gold from China’s reserves, we now expect further gold strength. We forecast gold to rise further to USD 1,350 / oz by 2Q19, USD 1,380 / oz by 3Q19, USD 1,400 / oz by 4Q19 and USD 1,450 / oz by 1Q20.
6 to 9 Months View
The monthly MACD for spot gold crossed into positive territory last month, the first time since February 2016 (see chart above). While a ‘positive crossover’ in MACD is generally viewed as a favourable development, other momentum indicators remain lackluster and spot gold does not appear to be ready for a sustained up-move (note that spot gold has been trading sideways for the past couple of years, holding within the 2016 range of $1,045.85/$1,374.90).
However, the underlying tone has clearly improved and for the next several months, the bias is for gold to move higher. That said, any advance in gold is expected to struggle to move above $1,400 as there is a stack of strong resistances just below this level (namely the 2018 peak of $1366.00, 2016 peak of $1,374.90 and the 2014 peak of $1,391.70). All in, there is a good chance that gold could at least test the cluster of strong resistance levels mentioned above but in view of the current lackluster momentum, any advance is expected to be slow and grinding. On the downside, a break below the $1,240.00 level would suggest gold could remain ‘caught’ within a sideway-trading range for longer.
Source: Global Economics & Markets Research, United Overseas Bank Group.


