For the fifth consecutive year, HSBC Holdings Plc is Europe’s largest bank by assets, according to the latest ranking by S&P Global Market Intelligence. The London-based bank reported €2.251 trillion in pro forma assets at the end of 2016, €174 billion more than Paris–based BNP Paribas SA, Europe’s second-largest.
Yet despite its heft, the British banking giant had a tepid 2016. Its profitability fell sharply and its total assets fell in U.S. dollar terms, the company’s reporting currency.
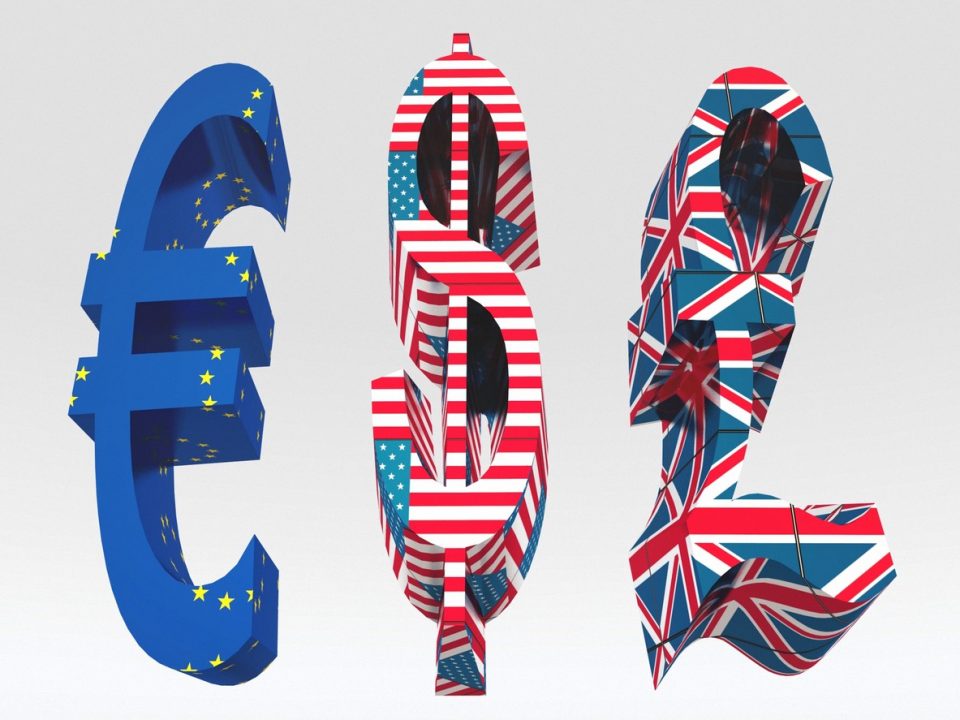
Overall, 2016 was a volatile year for European currencies, particularly the British pound following the U.K.’s vote in the summer to exit the EU. At the end of 2016, £1 bought €1.171, compared to €1.357 at the end of 2015. The euro bought $1.055 at the end of 2016, compared to $1.086 a year earlier, while the British pound fell to $1.235 from $1.474 over the same period.
The drop in the pound spurred a €225.36 billion drop in the asset size of London-based Barclays Plc, which nevertheless retained its position at number five in the ranking. At the end of 2016, the bank’s assets were worth €1.418 trillion, but would have been worth €1.644 trillion using the year-end 2015 conversion rate. Similarly, the drop in the pound versus the euro helped to knock number nine Lloyds Banking Group Plc and number 10 Royal Bank of Scotland Group Plc below the €1 trillion mark at the end of 2016.
Banco de Sabadell SA would have climbed a spot to number 37, but the adjustment for the pending sale of its U.S.-based subsidiary Sabadell United Bank NA caused it to fall to number 39 from number 38.
Germany has seven banks among the top 50, the most of any country, while France, Spain and the U.K. are each home to six.
In this ranking, company total assets were adjusted for pending mergers, acquisitions and divestitures, as well as M&A deals that closed after the end of the reporting period used through March 31 on a best-efforts basis. Assets reported by non-euro filers were converted to euros using period-end exchange rates.
The majority of banks were ranked by total assets as of Dec. 31, 2016. In the previous ranking published on April 19, 2016, most company assets were as of Dec. 31, 2015 and were adjusted for deals through April 15, 2016. No adjustments were made for differences between GAAP and IFRS filings.

