


For bond investors with long memories, 2026 has felt uncomfortably familiar. Government debt sold off across the world’s largest markets, the Federal Reserve raised interest rates for the first time since 2023, and the yield on the benchmark 10-year US Treasury note pushed through 5%, a level it had not held since 2007.
In United Kingdom, 30-year gilt yields climbed above 6%. In Japan, where near-zero borrowing costs were the norm for a generation, long-dated yields set records.
It is tempting to file 2026 alongside the great bond routs of the past. The numbers do not support that verdict.
By the end of October, the Bloomberg US Aggregate Bond Index, the broad benchmark for investment-grade American debt, was down just over half a percentage point for the year.
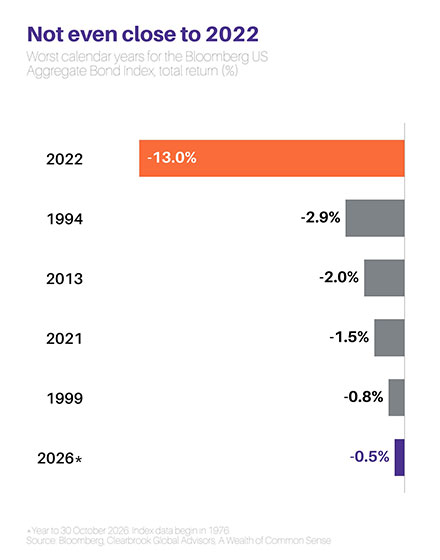
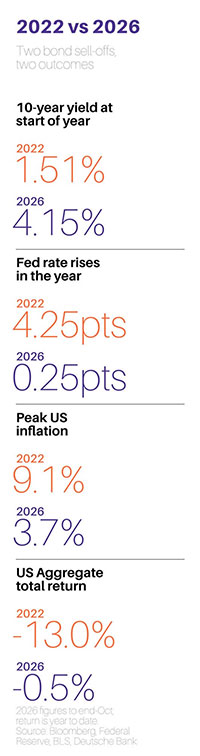
In 2022, the same index lost 13%, its worst calendar year since its data begins in 1976. Even at its low point at the end of September, the 2026 loss was under 3%.
The difference lies less in how far yields rose than in where they started. In 2022, investors entered the year holding bonds that paid almost nothing, so when rates jumped there was no income to absorb the price losses.
In 2026 they began the year with yields above 4%, and that income has done much of the work of protecting portfolios.
The sell-off has been sharp and global, but it has also left bond investors with the best starting yields in nearly two decades.
How the sell-off unfolded
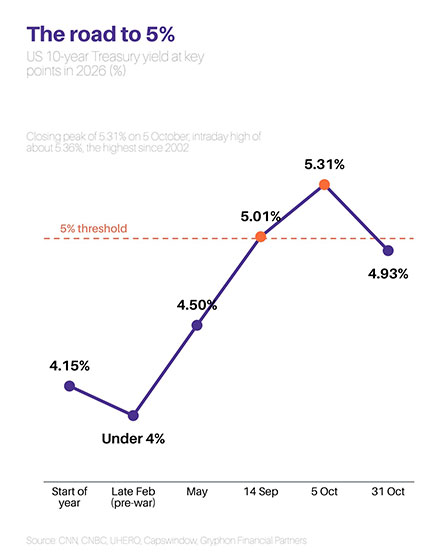
The year began quietly. The 10-year Treasury yield opened 2026 at about 4.15% and dipped below 4% in February, when markets still expected the Fed to keep cutting rates after its easing in 2025.
 The Bloomberg Global Aggregate Index, which tracks investment-grade government and corporate bonds worldwide, was up as much as 2.1% for the year by February 27.
That changed within days. At the end of February the United States and Israel launched strikes on Iran, and the war that followed choked the flow of oil through the Strait of Hormuz, the route for roughly a fifth of global oil trade.
Brent crude, which had traded in the low $70s before the war, climbed above USD 100 a barrel by mid-March. By then the Global Aggregate had given back all of its gains for the year.
US inflation, which ran at 2.4% in February, rose to about 3.5% by June and 3.7% by September, driven largely by fuel. Gasoline prices jumped 9.1% in September alone.
The 10-year yield reached 4.5% in May, eased over the summer, then rose sharply again in September, when strong economic data, oil prices back above USD 100 and fears of a Fed rate rise all hit at once.
On September 14 the 10-year yield touched 5% for the first time since October 2023.
Two days later the Fed raised its policy rate by a quarter of a percentage point to a range of 3.75% to 4%, its first increase since 2023, in a unanimous vote.
The selling did not stop there. Treasury auctions became market events, and an early-October sale of 10-year notes cleared at 5.30%, the highest auction yield since 2000. The 10-year yield closed at 5.31% on October 5 and touched an intraday high of about 5.36%, its highest since 2002.
Then the mood turned. A sharp sell-off in technology stocks, driven by doubts over the cost of building artificial intelligence (AI), sent investors back into government debt.
On October 22 the 10-year yield fell more than 17 basis points, its biggest one-day drop since March 2023, and it finished the month at about 4.93%.
 A synchronised global sell-off
What set 2026 apart from an ordinary American rate scare was how widely the selling spread.
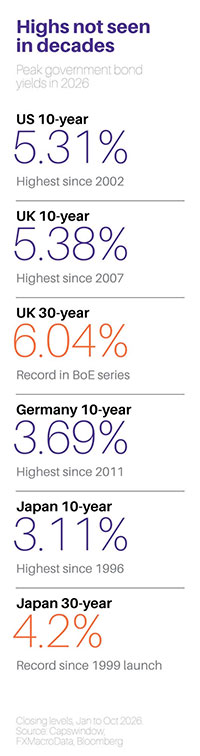
In Britain, the 10-year gilt yield reached about 5.38%, its highest since 2007, and the 30-year yield hit 6.04% at the start of October, the highest reading in the Bank of England’s data series.
Germany’s 10-year Bund yield rose to 3.69%, a level last seen in 2011, and its 30-year yield passed 4%. In France, political uncertainty and worries about the public finances kept pressure on government debt through the autumn.
Japan produced the most striking moves. The 10-year Japanese government bond yield rose above 3% for the first time since 1996 and reached 3.11% in early October, while the 30-year yield set a record of about 4.2%, the highest since that bond was first issued in 1999.
For a market in which the Bank of Japan held yields near zero for most of the past decade, those levels mark a lasting change.
The common thread is supply. Governments everywhere are borrowing more. Germany plans record issuance of about 525.5 billion euro in 2026 as it funds higher spending on defence and infrastructure. Britain expects to sell 246.2 billion pound of gilts in the 2026-27 financial year.
Japan’s new bond issuance for fiscal 2027 is reported at about 40 trillion yen, up from 32.7 trillion yen.
When supply rises at the same time as inflation risk, investors demand more compensation to lend for longer, and long-dated yields rise fastest.
Why yields climbed
Four forces drove the rise in US borrowing costs, and each made the others worse.
The first was energy. Oil above USD 100 a barrel fed directly into consumer prices and raised the risk that higher inflation would become entrenched.
 Producer prices rose 6.3% in the year to September, the largest gain since 2022. Core consumer inflation, which strips out food and energy, was more contained at 2.6%, which helps explain why the Fed has moved cautiously.
The second was the Fed itself. At the start of 2026 markets were debating how many times the central bank would cut rates.
By September, under its new chair Kevin Warsh, it was raising them. At its meeting on October 28 the Fed held rates steady in a 10-2 vote, with Governor Lisa Cook and Cleveland Fed President Beth Hammack preferring another increase. Futures markets now put the probability of a December rise above 80%.
The third was fiscal. The US federal deficit for the fiscal year to September came in at USD 1.992 trillion, up 12% on 2025 and equal to about 6% of GDP.
Gross federal debt passed USD 40 trillion in August. Net interest costs rose by USD 115 billion, or 11%, in a single year, and Washington now spends more on interest than on either Medicare or defence.
The fourth was corporate borrowing on a scale the bond market has not seen before. Technology companies building data centres for artificial intelligence have turned to debt markets because, by UBS estimates, their capital spending now absorbs close to all of their operating cash flow, against a 10-year average of about 40%.
Barclays expects total US corporate bond issuance to reach USD 2.46 trillion this year, up nearly 12% from 2025.
Every dollar of that debt competes with Treasuries for investors’ money.
These pressures show up in the term premium, the extra yield investors demand for holding long-dated bonds instead of rolling over short-term bills. By the New York Fed’s estimate, the 10-year term premium rose about 40 basis points between mid-September and early October to around 0.98%, its highest since 2014.
That rise accounted for more than the entire increase in the 10-year yield over the period. The autumn sell-off, in other words, was driven less by bets on Fed policy than by investors’ reluctance to lend to governments for long periods at the old price.
 Was this the worst year for bonds?
It was not. On the evidence so far, 2026 is not the toughest year in history for bond markets, and it is not close to 2022.
The Bloomberg US Aggregate lost 13.01% in 2022, its worst calendar year on record. Before that, its worst year was 1994, when it fell about 2.9% as the Fed doubled its policy rate within 12 months in what became known as the great bond massacre.
Global bonds fared even worse in 2022, with the Bloomberg Global Aggregate losing 16.25% in dollar terms. Ten-year Treasuries lost more than 15% that year, and Deutsche Bank calculated that their losses in the first half of that year were the steepest since 1788, the year before the US Treasury Department was founded.
Set against that record, 2026 looks painful but contained. The US Aggregate lost 3.51% in the third quarter, and by September 30 it was down 2.91% for the year.
Had the year ended then, the loss would have been almost identical to 1994’s, the second-worst year in the index’s history.
But October brought the index’s best month of the year, a gain of 2.44%, which cut the year-to-date loss to 0.54% by October 30.
The float-adjusted Global Aggregate was down 1.26% over the same period.
The size of the moves also differs. In 2022 the 10-year Treasury yield rose from 1.51% to 3.88%, an increase of more than 2.3 percentage points, while the Fed raised rates by 4.25 percentage points, the most in a single year since 1980.
In 2026, the 10-year yield rose about 1.2 percentage points from its January level to its October peak, and the Fed has so far raised rates by a quarter of a point.
None of this means bond investors have had an easy time. Over longer periods, the damage is severe.
Ben Carlson, a portfolio manager at Ritholtz Wealth Management, has pointed out that the current cycle produced the first negative five-year rolling returns in the history of the Aggregate index, and that 10-year returns after inflation are as poor as they have ever been.
He called it “the most brutal bond market in modern finance history”. The 2026 sell-off was not the worst single year, but it added fresh losses for investors who had barely recovered from 2022.
Higher yields, thicker cushion
The main reason 2026 has not repeated 2022 is income. A bond’s return over a year comes from two sources, the interest it pays and the change in its price.
When yields rise, prices fall, but the coupons keep arriving. The higher the starting yield, the more price damage those coupons can offset.
At the end of 2021, the US Aggregate yielded under 2%, so even a small rise in rates was enough to wipe out a year’s income. By the end of October 2026, the index had a yield to worst of 5.24% and a duration of about 5.8 years.
As a rough guide, that means yields would need to rise by around 90 basis points over a year before investors in the index lost money.
Vanguard calculates that the Aggregate’s yield rose about 120 basis points this year up to late September, yet total returns were down only about 2.5%, because investors started from a far stronger income base.
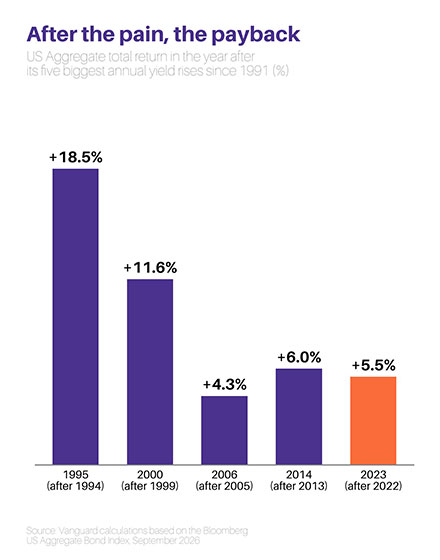
History offers some encouragement. Vanguard looked at the five years since 1991 with the largest annual rises in the Aggregate’s yield, namely 1994, 1999, 2005, 2013 and 2022. Each was followed by a year of positive returns, of 18.5%, 11.6%, 4.3%, 6.0% and 5.5% respectively.
The asset manager sees the closest parallel to 2026 in 1999, when Treasury yields rose about 1.7 percentage points as the economy grew strongly and the Fed raised rates.
Bonds began to rally in 2000, while the Fed was still tightening and well before it started cutting in 2001.
“Rate cuts aren’t required for bonds to work,” said Matt Wrzesniewsky, Vanguard’s head of fixed income client portfolio management.
Investors now have choices they lacked for most of the past 15 years. Cash pays about 4%.
Even after October’s rally, high-quality bonds pay close to 5%, and investment-grade corporate debt pays more.
 Bonds behaving like bonds again
One of the most damaging features of 2022 was that bonds fell at the same time as shares. A portfolio of 60% US stocks and 40% bonds lost more than 16% that year, one of its worst results on record, because the bond portion offered no protection.
October 2026 showed the opposite pattern. As technology stocks slumped on fears that spending on artificial intelligence would not pay off, the Nasdaq lost 5.3%, its worst month since March 2025, while US government bonds returned 2.4%.
Japanese, German and British government bonds gained between 1.6% and 1.8%, and the Global Aggregate rose 1.4%. US municipal bonds were on course for their best October since at least 1980.
That matters for anyone who holds bonds to balance risk. When yields are close to zero, government bonds have little room to rally in a crisis.
At 5%, they do. The return of a negative relationship between bond prices and growth stocks suggests fixed income can once again cushion a portfolio during an equity sell-off, which it failed to do in 2022.
The risks that remain
October’s rally does not mean the sell-off is over, because the conditions that pushed yields higher are still in place. Headline inflation is running well above the Fed’s 2% target, and markets expect another rate rise in December.
A Wall Street Journal survey of 71 economists in mid-October put the expected 10-year yield at 5.1% by the end of the year, above where it closed October.
Brent crude remains above USD 100 a barrel and traded as high as USD 117 in late October on concerns that the US could resume strikes on Iran.
The fiscal outlook offers little relief. The Congressional Budget Office projects that annual deficits will grow to USD 3.1 trillion by 2036, and higher interest rates make that path more expensive, since the government must refinance maturing debt at today’s yields.
The Bank of Japan is stepping back from a bond market it dominated for years, and Europe is borrowing heavily to fund defence. Any of these could push the term premium higher again.
Technology debt is a further risk. Much of the new corporate borrowing funds data centres whose returns are still uncertain, and if revenue from artificial intelligence disappoints, spreads on that debt could widen. Against all of this sits the yield itself.
At around 5%, a 10-year Treasury offers a buffer that did not exist four years ago.
The verdict
2026 will be remembered as the year bond yields returned to levels last seen before the global financial crisis, and as the year Japan’s era of near-zero borrowing costs ended.
It was a global sell-off, fed by war, inflation, heavy government borrowing and a corporate debt boom, and it forced the Fed to change direction.
It was not, however, the worst year for bonds. That title still belongs to 2022, when investors lost heavily on bonds that paid them almost nothing. The yield at which an investor buys a bond matters as much as what happens to rates afterwards.
Investors in 2022 learned that bonds can lose money. Those in 2026 are learning that, bought at the right yield, bonds can absorb a shock and still pay their way.